Research explainer / Seasonal thaw
The Layer That Thaws Each Year
A probe enters the soil, meets resistance and leaves a number in a notebook. Understanding that number requires timing, repetition and attention to the surface beneath your feet.
Identify the seasonal layer
The active layer is the ground above permafrost that thaws in the warm season and refreezes in the cold season. Its thickness is commonly described using the maximum seasonal thaw depth. That maximum cannot be assumed from an arbitrary summer visit: thaw may continue after the warmest air temperatures have passed, and the timing varies among places and years.
Researchers distinguish a thaw-depth measurement on a particular date from a defensible estimate of annual active-layer thickness. Repeated observations through the thaw season improve that estimate. Where a study uses a single late-season survey, its methods should explain why the timing is suitable and how departures from the seasonal maximum might affect comparison.
Return to a fixed sampling pattern
A fixed grid helps researchers return to the same area and quantify small-scale variation. The Circumpolar Active Layer Monitoring network, known as CALM, coordinates observations using documented site protocols. Grid measurements can show whether thaw is broadly similar across a site or concentrated in particular surface conditions. The number and spacing of points should be reported rather than assumed.
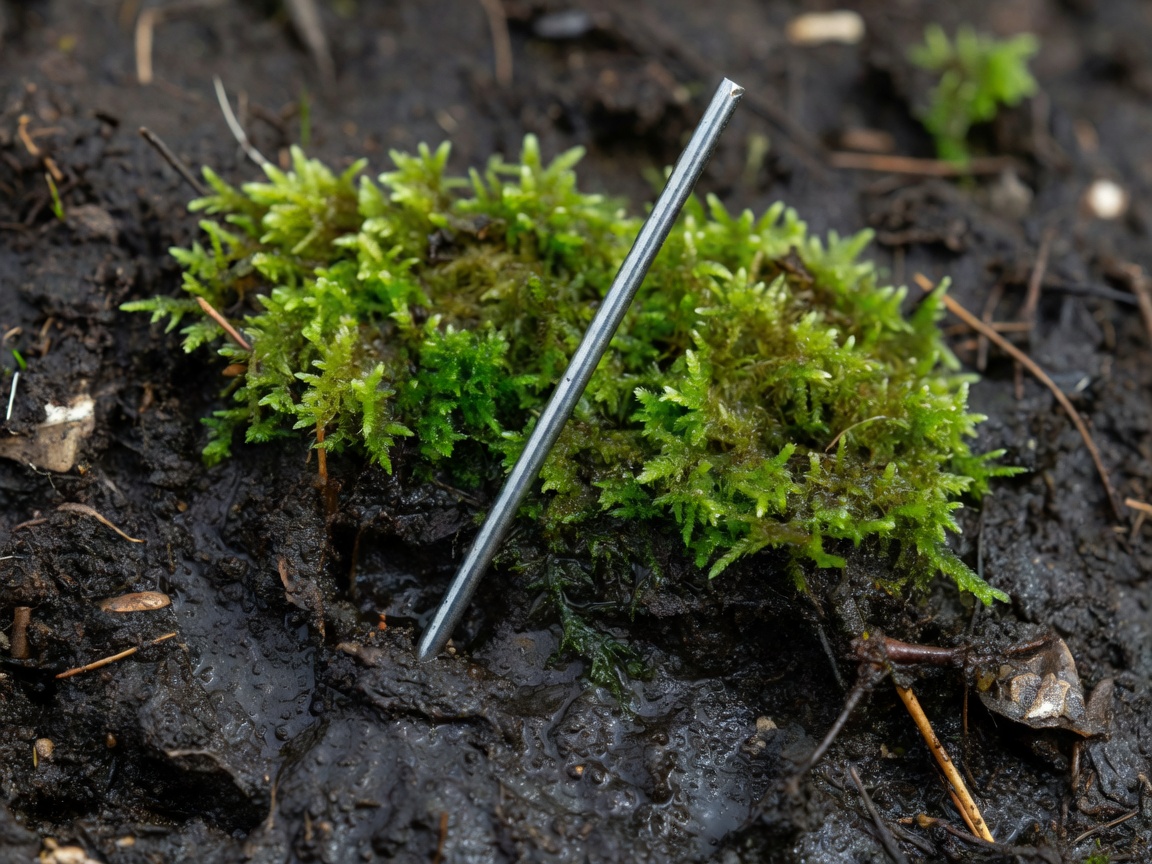
At each point, a metal probe may be pushed gently into the ground until it reaches frozen material. The depth is read relative to the surface. Stones, roots and coarse sediment can also stop a probe. Experienced observers record uncertain refusal rather than automatically treating every obstruction as the thaw boundary. A missing or ambiguous value is more useful than a falsely precise one.
Write down what surrounds the point
Organic surface layers often insulate the ground, while soil moisture affects heat transfer and the energy required for thaw. Snow depth influences winter cooling and can alter the starting conditions for the next thaw season. Water accumulation, vegetation height, slope and exposure help explain differences between neighbouring points. None of these factors operates in isolation.
Field teams therefore pair depth observations with site descriptions, photographs and, where available, soil or weather measurements. A wet hollow and a dry ridge should not be pooled without considering what that pooling means. If a grid loses points because they become inaccessible or flooded, the sampling change must remain visible in the analysis.
- Thaw depth
- The depth from the current surface to the observed thaw boundary on a stated date.
- Active-layer thickness
- The seasonal maximum thickness of ground that thaws and refreezes above permafrost.
- Talik
- A body of unfrozen ground in a permafrost region that persists beyond a single seasonal thaw.
Check whether the surface moved
Thaw depth is usually measured downward from the present surface. If ice-rich ground subsides, that reference surface can move. The measured depth might remain similar even while the elevation of the thaw boundary changes. Surveying surface elevation against a stable reference can help separate these processes. This distinction is especially important where excess ground ice is melting.
A mechanical probe also has practical limits. Very deep thaw, rocky ground or fragile surfaces may call for other methods. Temperature strings show the thermal transition through time, while frost tubes can indicate freezing and thawing boundaries under suitable conditions. These methods do not produce perfectly interchangeable observations; their operating principles and uncertainty need to be stated.
| Method | Strength | Watch for |
|---|---|---|
| Mechanical probing | Many spatial observations during a visit | False refusal and limited penetration |
| Temperature sensors | Seasonal timing at fixed depths | Sensor spacing and near-zero ambiguity |
| Surface-elevation survey | Reference for settlement or heave | Stability of the survey benchmark |
Describe the distribution, then the change
A site mean is useful, but the spread of measurements also matters. Report the sample count, spatial variability and rules for missing observations. If possible, compare the same points across years. A deeper average from a different subset of the grid may reflect changed sampling as well as changed ground conditions.
Long-running work near Utqiaġvik in Alaska and studies in the Lena River Delta in Siberia illustrate the value of repeated observations in distinct environments. Samoylov Island is a well-known setting for polygonal tundra research. These places are not substitutes for one another: hydrology, sediment and local climate shape their responses. A pattern at one grid should be extended only as far as its representativeness supports.
Active-layer observations complement borehole temperatures rather than replacing them. Together, they connect seasonal surface processes to the longer thermal state below. Landscape observations add another scale, helping researchers see where an individual grid fits within a much larger mosaic.
Source trail
- GTN-P: CALM and thermal monitoring context
- Alfred Wegener Institute: polar and permafrost research
- Toolik Field Station: Arctic research setting