Research explainer / Landscape observation
Seeing Change Across a Landscape
Start with what the image records. Then ask which ground processes could produce that pattern, and what additional evidence would distinguish them.
Name the visible signal
Satellite and aerial observations extend research beyond the footprint of a borehole or field grid. They can reveal changing lake margins, exposed sediment, vegetation patterns and surface movement. Their strength is spatial coverage and repeat observation. Their limitation is equally important: a surface signal is not a direct measurement of the temperature of permafrost several metres below.
An optical image records reflected radiation in selected wavelength bands. Researchers interpret those measurements using processing methods, comparison images and field knowledge. A dark patch may be water, shadow, wet soil or a processing artefact. Before giving it a process-based label, examine acquisition date, illumination, cloud screening and the surrounding terrain.
Match the instrument to the question
Landsat provides a long archive for examining landscape change. Sentinel-2 supplies multispectral observations useful for vegetation, water and exposed-ground mapping. Both require careful treatment of clouds and seasonal conditions. Comparing early snowmelt in one year with late summer in another can create apparent changes unrelated to the longer-term process being investigated.
Sentinel-1 radar observations can support surface-motion analysis using interferometric synthetic aperture radar, often called InSAR. Radar can operate without daylight and through many cloud conditions, but useful measurements still depend on the surface retaining a sufficiently coherent radar response. Vegetation changes, snow, water and rapid disturbance can reduce that coherence.
| Observation | Useful for | Key limitation |
|---|---|---|
| Optical imagery | Water, vegetation and exposed-surface patterns | Clouds, shadows and seasonal differences |
| Radar interferometry | Relative surface movement along the viewing direction | Loss of coherence and ambiguous motion sources |
| Elevation models | Terrain form and elevation differences | Registration error and acquisition mismatch |
Distinguish movement from its cause
Surface lowering may be consistent with thaw of ice-rich ground, but other processes can contribute. Seasonal freezing and thawing, changes in water storage, erosion and sediment compaction can also affect elevation. InSAR measures displacement along the satellite’s line of sight, not automatically pure vertical settlement. Viewing geometry and reference choices must remain part of the explanation.
Repeat elevation models offer another way to investigate topographic change. ArcticDEM, developed through the Polar Geospatial Center and partners, is a useful terrain resource. Differences between elevation products need careful alignment and error assessment. A small apparent change near a steep slope may be caused by horizontal misregistration rather than real ground movement.
- Pixel
- A spatial sampling element; features smaller than it may be mixed with their surroundings.
- Coherence
- The similarity of radar signals between acquisitions, important for reliable interferometric analysis.
- Ground reference
- Field observations used to evaluate or interpret a remotely sensed measurement or classification.
Bring the map back to the field
A useful field campaign tests the interpretation rather than merely photographing a matching scene. Researchers may record soil composition, exposed ground ice, surface elevation, thaw depth and drainage conditions. Georeferenced photographs and repeat visits help determine whether mapped changes reflect persistent processes or temporary conditions. Validation samples should include difficult cases, not only clear examples.
Thermokarst describes landforms and processes associated with thawing ice-rich permafrost and resulting ground subsidence. It is not a label for every Arctic pond or irregular surface. Ice-wedge polygons, thaw slumps and drained lake basins have distinct histories. A map that groups them together may be convenient, but it should explain the classification and its consequences.
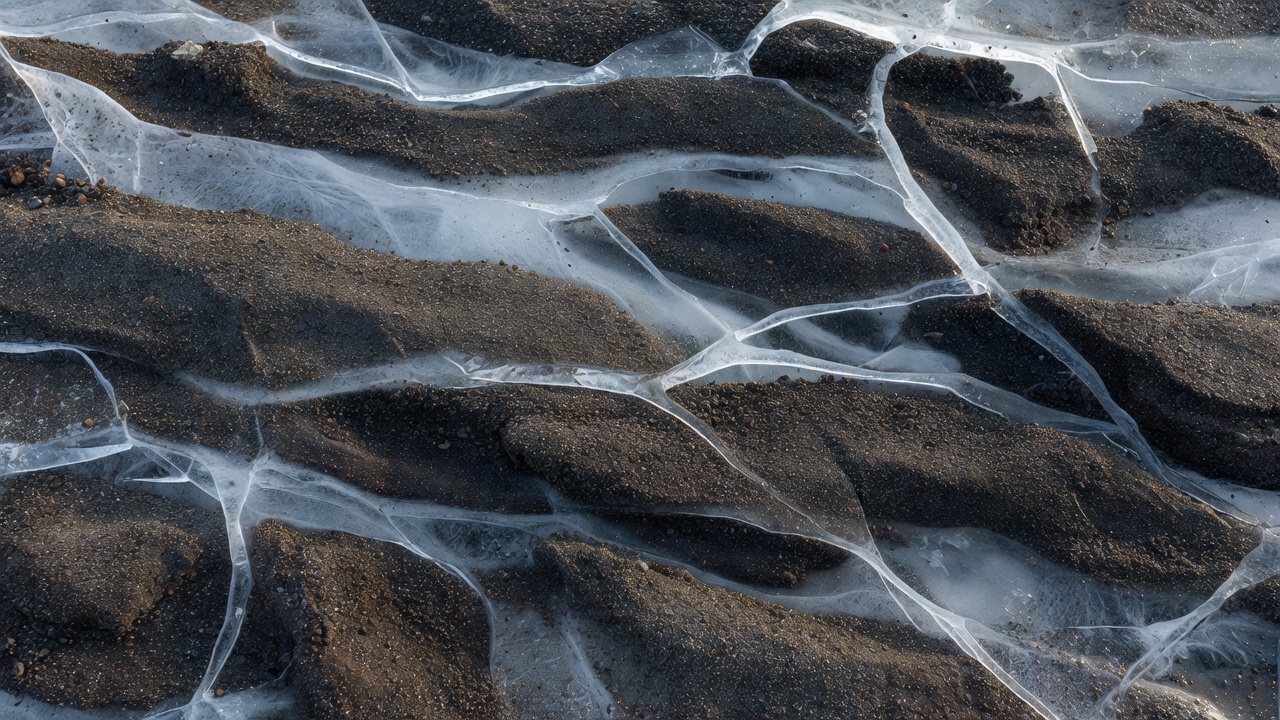
Keep scale and geography visible
The Yamal Peninsula, the Yukon coast and the Mackenzie Delta contain widely studied permafrost landscapes, but their sediments, water systems and disturbance histories differ. A classification developed for one setting may perform poorly in another. Report where a method was tested and how representative the validation data are before presenting a circumpolar conclusion.
Spatial resolution also shapes what can be observed. A narrow erosion feature may occupy only part of a pixel, while a broad lake boundary may be mapped confidently. More detailed imagery does not automatically remove uncertainty; it can reveal new complexity and demand more careful classification. Report a minimum mapping scale and avoid treating an unmapped feature as proof of absence.
The strongest landscape interpretation connects independent observations: an image sequence, field descriptions, elevation evidence and nearby thermal records where available. Agreement supports a process explanation, while disagreement identifies what needs further investigation. Neither outcome justifies inventing a continuous record between visits or implying that a static map is live monitoring.